In every grant application, I want to see a simple visual guide (a Gantt chart) that shows what you are planning to do. It is the perfect time to plan your project clearly. It shows the assessors that you have thought about your research in detail and, if it is done well, it can serve as a great, convincing overview of the project.
Clearly, these charts are hard to do. If they were easy, more people would do them, right?
Here are five steps to create a simple guide to your research project.
1. List your activities
Make a list of everything that you plan to do in the project. Take your methodology and turn it into a step-by-step plan. Have you said that you will interview 50 people? Write it on your list. Are you performing statistical analysis on your sample? Write it down.
Check it against your budget. Everything listed in the budget should also be listed on your uber-list? Have you asked for a Thingatron? Note down that you will need to buy it, install it, commission it… What about travel? Write down each trip separately.
2. Estimate the time required
For each item on your list, estimate how long it will take you to do that thing. How long are you going to be in the field? How long will it take to employ a research assistant? Realistically, how many interviews can you do in a day? When will people be available?
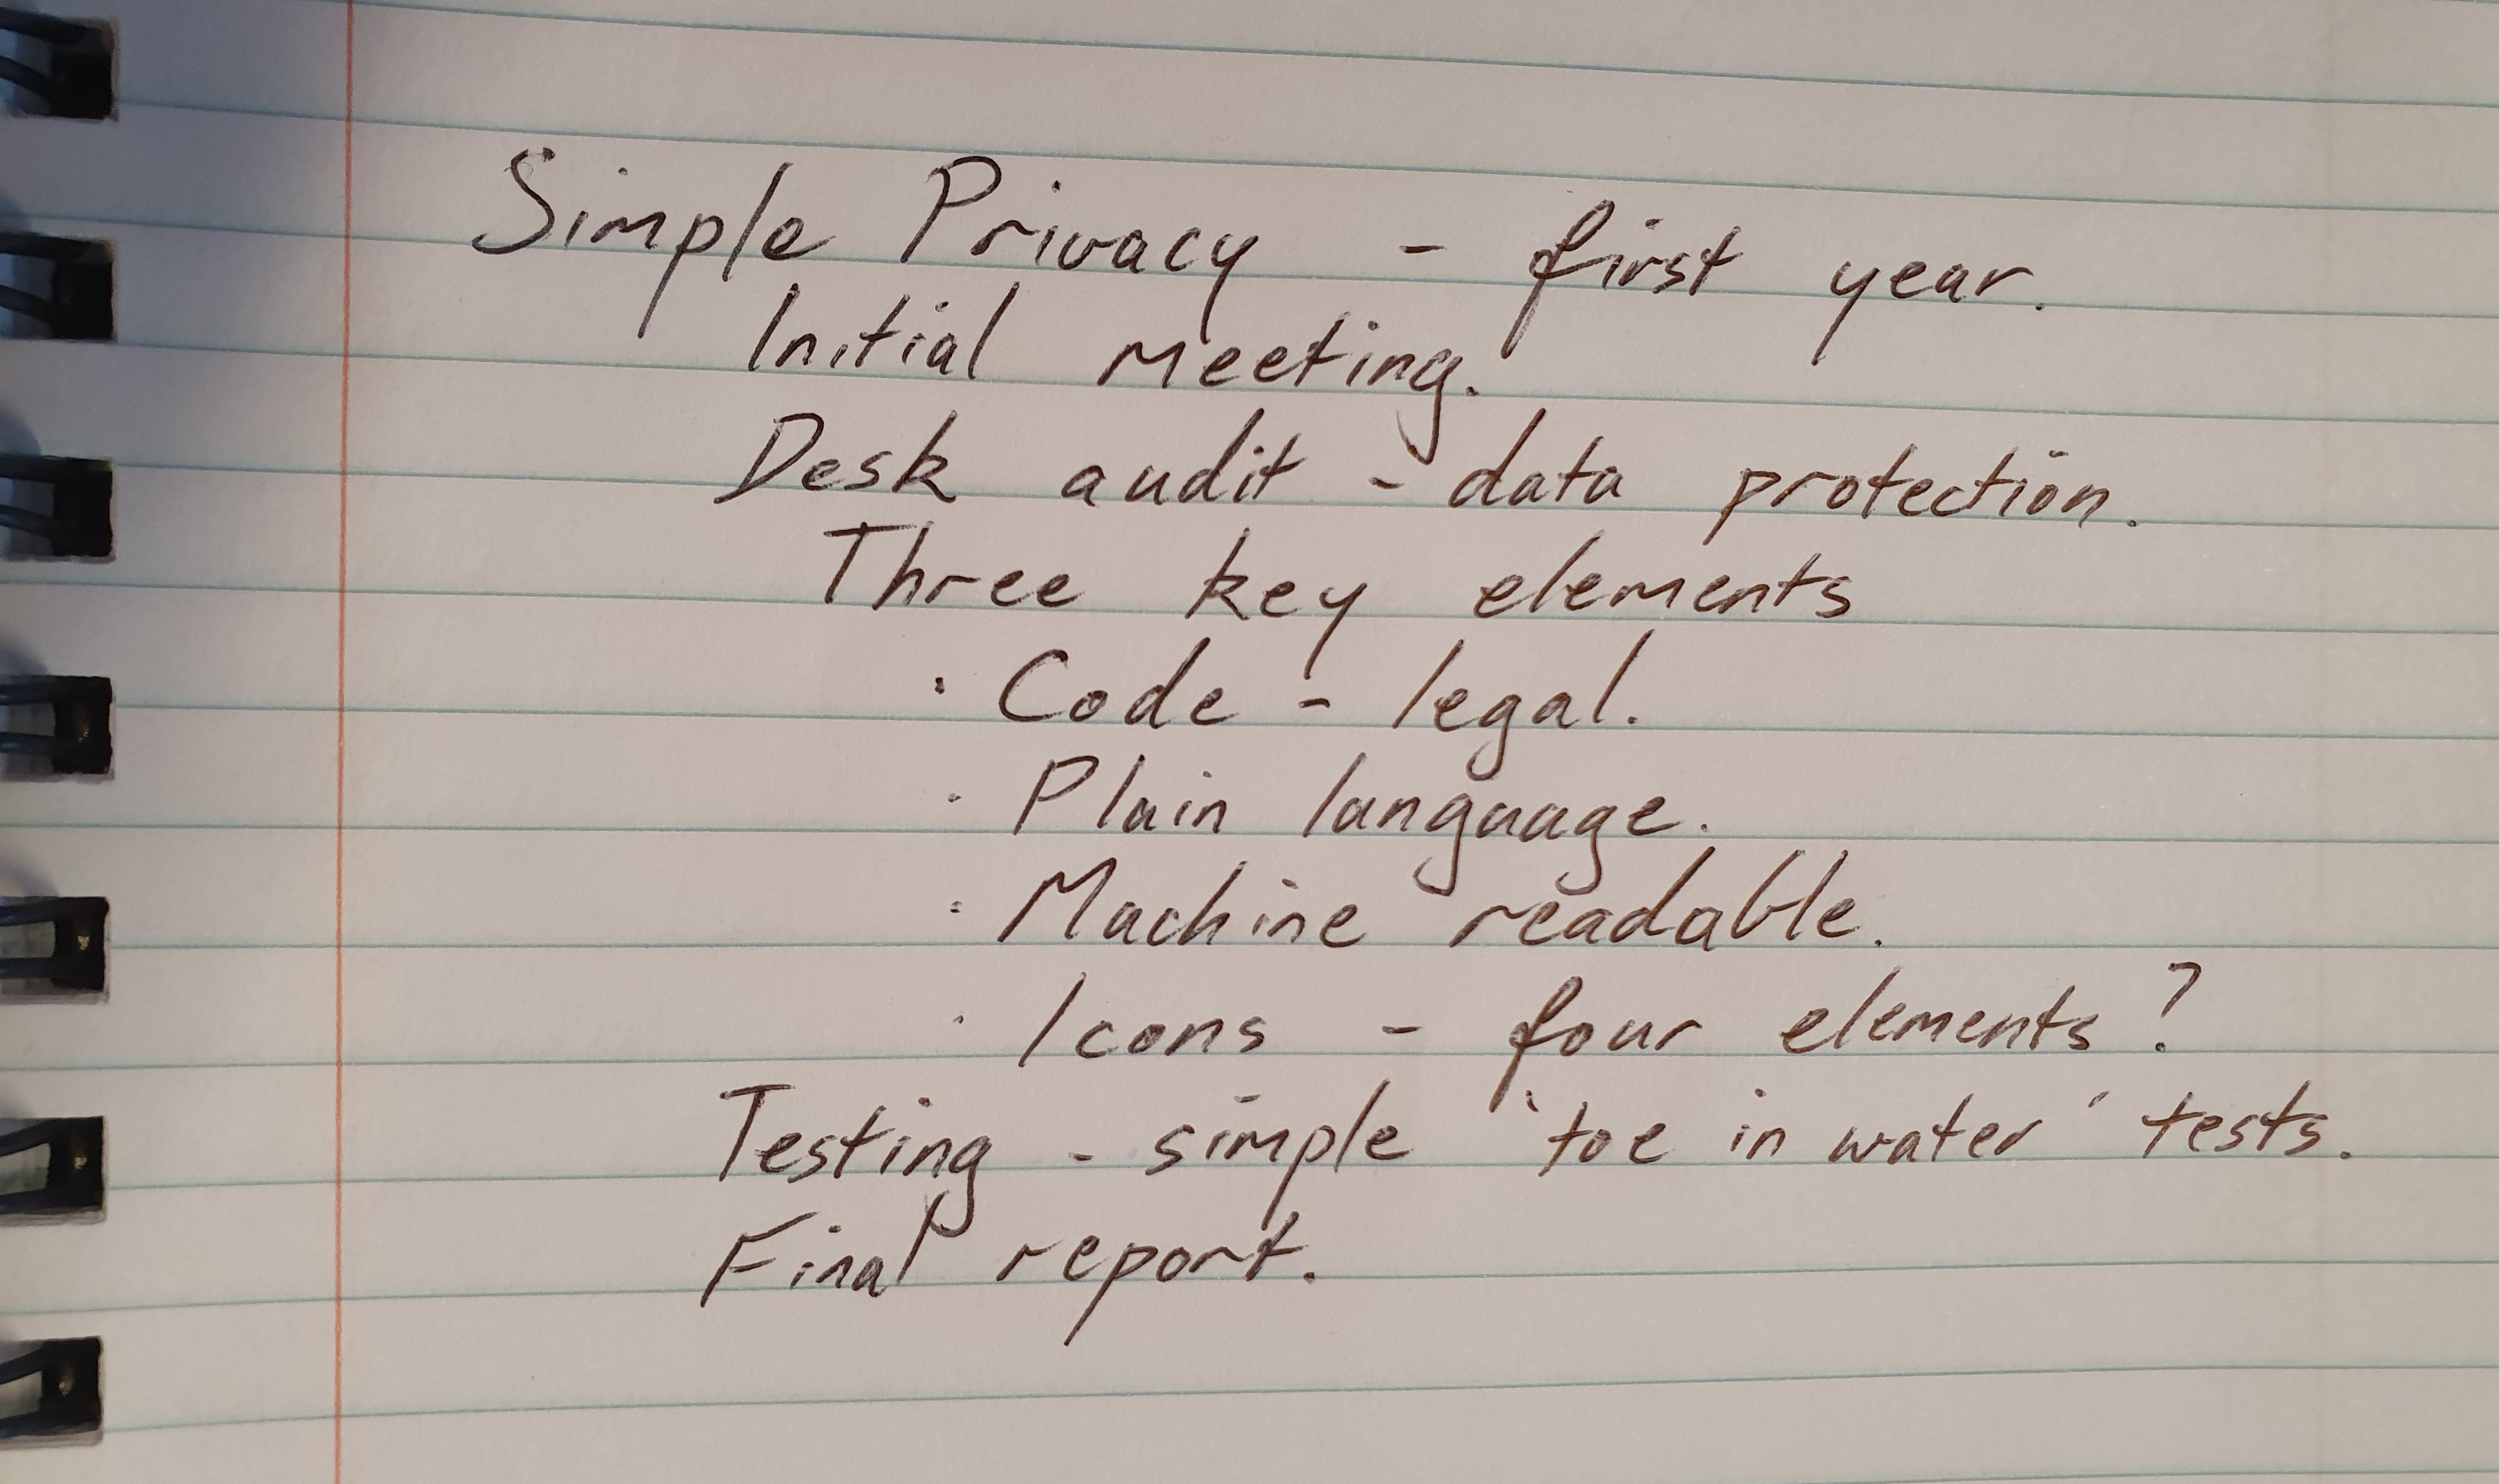
- Initial meeting: about 3 weeks to find a time.
- Desk audit: 4 months.
- Draft key elements: about 1 week each.
- Testing: about 1 week each, but can start organising as soon as first element is drafted.
- Write up: 2 months.
- Final report: no time, really – just need to find a time to meet.
Generally, I use weeks to estimate time. Anything that takes less than a week I round off to a week. Small tasks like that will generally disappear from the list when we consolidate (see Step 4). Then I group things together into months for the actual plan.
3. Put activities in order
What is the first thing that you are going to do? What will you do next? What will you do after that?
In the comments, Adrian Masters provided some great questions to help with this stage:
- What do I need to do by when?
- What do I need from others & when?
- How do I check that I am still on track?
One by one, put everything in order. Make a note of any dependencies; that is, situations where you can’t do one thing until another is started or finished. If the research assistant is going to do all the interviews, then the interviews can’t start until the research assistant is hired.
Where possible, you should eliminate as many as possible dependencies. For example, if you can’t find a decent research assistant, you will do the fieldwork yourself (but that might mean that work will be delayed until you finish teaching). It isn’t a necessary step to getting your time-line in order, but it is good project management practice.
In the comments, Amy Lamborg pointed out that you might want to work backwards. If you have a fixed end date, you might want to “…build back towards the project start date, then jiggle everything until it fits!” If you want an example of this, have a look at the post “Work backwards“. It is about writing an application, but the principle of starting with the fixed end date and working backwards still applies.
4. Chunk it up
Now that you have an ordered list, and you know how long everything will take, you need to reduce the list without losing any specificity. At the same time, if you are combining tasks, you might want to add a bit of time as a contingency measure.
- Meet with partners: 3 weeks.
- Review data protection regimes: 4 months.
- Draft three key elements: 3 months.
- Test three key elements: 3 months, with some overlap.
- Analyse test results and report: 3 months.
How you divide up your time depends on your project. If it is only one year long, you might list items by month. If your project is three years long, then you might list items by quarter. If you are planning over five years, you might break it down to six-month periods.
5. Draw me a picture
If you use project management software to manage your project, and you are comfortable with it, then use it to produce a summary of your project, too.
Most project management software (e.g. like Microsoft Project) will allow you to group activities into summary items. Chunk your tasks into major headings, then change the time interval to your months, quarters, half-years, or whatever you have chosen to use.
Or you can just draw it up with word-processing software (which is what I always do), spreadsheet software, or even hand-draw it.

Frankly, I don’t care – as long as it ends up in your application!
Also in the ‘simple grant’ series:

This is useful. I’m writing my first SERIOUS research proposal for my PhD. Obviously not something I’ve ever done before so all advice is greedily welcome.
LikeLike
My best advice – write something quickly and then get someone else to look at it. I’m a big fan of quick iterations to get started.
LikeLike
Your readers might be interested in Tom’s Planner (http://www.tomsplanner.com). It’s a very easy tool to help you create a schedule or project plan (and there is a free version). On our blog we have a bunch of guest blogs about planning your thesis or dissertation with a template and example to help you get started.
LikeLike
The free version is a farce you cannot print, export or do anything but view it online. So don’t waste time with this product it is not a real proof of concept.
LikeLike
Sometimes, when the chunks are too big, you end up failing to understand what’s in those chunks, then your estimate ends up WAY off when you realize the extra work you didn’t consider might go into a give task.
LikeLike
That looks like a useful technique for getting the right information together for a Gantt. I’d be interested in any techniques for step 5. It’s something I’ve done recently as part of my first year PhD report and I wrote about how I produced my Gantt chart here:
http://phdtools.blogspot.com/2011/08/creating-gantt-charts.html
I can’t imagine many people use MS project to manage their entire PhD (I could be wrong?) therefore it seems a bit excessive to use it just for a Gantt chart. Equally I find Excel plots look a bit naff and it’s difficult to show linkages between items.
LikeLike
Hi Welf
Absolutely! I just want to plug in my info and get a simple image out. How hard is that?
I’m not a big fan of big-iron project management tools either. More time seems to go into managing the information than getting actual work done.
I do think that most group projects that are going to last twelve months or more could do with a simple project management tool, though. I’m a bit of a fan of Basecamp, even if it doesn’t draw Gantt charts.
Of course, everybody has to understand the tool and want to use it, which is a different matter.
LikeLike
Thanks for the post.
I’m currently trying my hand at project management software, but I seem to find it easier to simply write down stuff in a piece of paper before committing it to electronic format. Anybody else has the same issue?
LikeLike
Absolutely, Carlos. As someone who has managed a big project that included spending a lot of time wrangling MS Project, I’m a big fan of just scribbling it down on paper and then mocking it up in MS Word.
LikeLike
[…] How do you create a Gantt chart? The best advice we have seen is at the useful Research Whisperer blog, where they list 5 steps to creating your very own Gantt Chart in the post ‘How to make a simple Gantt chart’. […]
LikeLike
Excellent introduction to project planning. I’ve seen recent examples of project managers jumping into MS Project without this level of thinking, with predictable results.
Questions that should help (and which you would need to answer anyway when asked by seeking funding or approval) include: What do I need to do by when? What do I need from others & when? How do I check that I am still on track?
Build those answers into the simple paper approach above, and you’ll have covered the critical project basics (activities, resources, dependencies, scheduling, milestones and checkpoints)
LikeLiked by 1 person
Thanks, Adrian.
I liked your questions so much, I added them into the original post. 🙂
LikeLike
An Excel bar chart is pretty much all you need to create a Gantt chart. Unless of course you intend to explore resourcing and costs.
LikeLike
Your info really helped me by doing my D.T ( Design Technology) homework.
Thank You 🙂
Eirene Masri
From Jordan, Amman
LikeLike
Hi Eirene
Thanks for your comment. It made me smile. 🙂
I haven’t been to Jordan for a very long time, but I had a great time when I was there.
Jonathan
LikeLike
[…] that you are going to do? What will you do next? What will you do after that? In the comments, Adrian Masters provided some great questions to help with this […]
LikeLike
Thanks for this particular piece of ‘whisper’… I was in a dire need of a ‘quickie’ method to make a simple Gantt Chart. 😀
Cheers,
Yan
London
LikeLike
No worries, Yan. Happy to help.
LikeLike
[…] Jonathan. “How to make a simple Gantt Chart” The Research Whisperer. 13 September […]
LikeLike
I have just gone through.Iam also planning to undertake a phd programme and would want to recieve guild as i make progress using gantt Chart
LikeLike
Reblogged this on Queer Fear: Alternative Gothic Literary and Visual Cultures and commented:
Stumbled across this useful piece on the use of Gantt charts in research projects. I realise this may seem rather common knowledge to scientists but as a Arts and Humanities-based person I found it gave useful insights for new researchers.
LikeLike
Thanks, Hanoconnor.
I suspect that there are plenty of science people who don’t get any formal training in this, either.
Jonathan
LikeLike
good job. very helpful
LikeLike
[…] Read More At: https://theresearchwhisperer.wordpress.com/2011/09/13/gantt-chart/ […]
LikeLike
This is my first time using a Gantt chart in research paper.. hmm. thanks for the info. 🙂
LikeLike
Gantt charts are really useful. Thanks for posting this information about gantt charts. This is a very informative post and very helpful, too.
LikeLike
Thanks Jonathan. I have just completed my first Gantt chart for my Doctorate in Health. I was beginning to get a bit jumpy about some of the very involved instructions I had found previously so your ‘idiots guide’ was really helpful.
LikeLike
No worries, Ade.
Happy to help. Good luck with your doctorate.
Jonathan
LikeLike
I have been using a Gantt chart to plan and track my doctorate since I began last year. It’s just an Excel spreadsheet but suits my purposes, very simple. One thing I’ve found useful us to mark all the highlighted cells bright blue initially, for ‘future action’. Each week, I update that week’s column to green (completed) or red (overdue). This gives me good feedback not only about where I need to change the priorities on my current ‘to do’ list, but is a very satisfying display of how much I’ve already done.
LikeLike
I love Excel, postgradpanda. I reckon that seeing the blue change to green would be very satisfying.
Thanks for this.
Jonathan
LikeLike
[…] https://theresearchwhisperer.wordpress.com/2011/09/13/gantt-chart/ […]
LikeLike
Thanks for this. It helped me alot for doing our work schedule in research for short allotted time.
LikeLike
Ohh Thank God Jonathan for that!! you have no idea how much you saved my life.. I was having a real hard time planning my first ever research proposal
Loved it alot.. Looking forward for much guidance along the path!!!
Sruti… (From a far far away land.. INDIA)!! 🙂
LikeLike
Thanks, Sruti
Happy to help.
Jonathan
LikeLike
Sruti was right. It’s very helpful to me as well. Saves me a lot of trouble. Keep it up Jonathan.
LikeLiked by 1 person
No worries, Paul
Are you a commercial representative for Ganttic, or did you link to them because you like them? Just wondering.
Jonathan
LikeLike
[…] published a short article about doing research in academia. Some of their articles are mundane (How to make a simple Gantt chart), whereas others are more esoteric (Hashing it over) and heartfelt (Academic […]
LikeLike
[…] out your timeline and your budget. Working up a Gantt chart for your project will force you to think about how long different phases of the project will take. This is important […]
LikeLike
list any six elements that go into the format of a research report?
LikeLike
Hi abukamara
I don’t have a set list. It depends who your audience is, and what sort of report you are writing.
I’m usually helping people to write grant applications, where the format is set by the funding agency. They make it pretty simple, really – they generally tell you exactly what they want.
Jonathan
LikeLike
[…] logframe analysis is well worth reading, while the Research Whisperer explains how to make a simple Gantt chart. And Mind Tools overviews a range of project scheduling tools as does this from MIT. Over at […]
LikeLike
[…] take you three or maybe three-and-a-half years. However, PhDs in my area rarely follow the sort of gantt chart anybody approving funding, ethics clearance or candidature milestones might approve. A tangent I […]
LikeLike
[…] How to make a simple Gantt chart – Jonathan O’Donnell. […]
LikeLike
Jonathan, i suppose that you should try more intuitive service) My experience in project management tells me there are a lot of comlicated tools such as MS Project. After years of searching and trying (Wrike, Liquid Planner, Smartsheet) i start using GanttPRO, especially because of its simplicity and high visibility.
So try GanttPRO to facilitate workflow.
LikeLike
[…] O’Donnell, J 2011, How to make a simple Gantt chart, The Research Whisperer, weblog, 13 September, viewed 23 April 2017, <https://theresearchwhisperer.wordpress.com/2011/09/13/gantt-chart/>. […]
LikeLike
[…] research design is important. Following the steps outlined in O’Donnell’s (2011) blog How to make a simple Gantt Chart, I constructed this graph and a risk matrix to ensure that my time was used efficiently. […]
LikeLike
[…] O’Donnell, J 2011, How to make a simple Gantt chart, The Research Whisperer, weblog, 13 September, viewed 23 April 2017, <https://theresearchwhisperer.wordpress.com/2011/09/13/gantt-chart/>. […]
LikeLike
[…] Other tips on Gantt charts, including how to make one manually: https://theresearchwhisperer.wordpress.com/2011/09/13/gantt-chart […]
LikeLike
Thanks Jonathan! I am a grant writer, and your post is a great reminder that I should probably make a timeline visually appealing, like your hand-made Gantt. I’m going to do it!
I wanted to point out that for a grant funded project (which often has a specified end date by which the money must be spent), I often find myself making a timeline backwards. That is, I start creating the timeline from the specified end date, and then ask myself the questions that Adrian Masters posed: What do I need to do by when? What do I need from others & when? I build back towards the project start date, then jiggle everything until it fits!
BTW, did you know that in your text descriptions of the example timeline, the time is in weeks, but in your Gantt chart the time is in months? I have a feeling that you really meant for these to match….
LikeLiked by 2 people
Thanks, Amy
This article has been viewed over 150,000 times, and you are the first person to point out the weeks / months issue. I’ve fixed it now (although it is a bit of a bodge).
I agree with the backwards process, so much so that I wrote a post about it: Work backwards. It is about the grant writing process, but the principle is the same.
This particular instance was one of those rare times when I truly didn’t have an end date, and could work out the actual time the project would take (surprise – it took longer).
I’ve added a bit into the post about working backwards. Thanks for that.
Jonathan
LikeLiked by 1 person
Proofreading touchdown? You just made my day! Thanks for this, and for Research Whisperer in general. I am probably not really your intended audience, but I get a lot of value from all the posts. You-all do good work!
LikeLiked by 1 person
[…] Research Whisperer. (2016). How to Make a Simple Gannt Chart.[online] Available at:https://theresearchwhisperer.wordpress.com/2011/09/13/gantt-chart/ [Accessed 14 Mar. […]
LikeLike
[…] O’Donnell, J 2011, ‘How to make a simple Gantt chart’, The Research Whisperer, 13 September, viewed 13 April 2018, <https://theresearchwhisperer.wordpress.com/2011/09/13/gantt-chart/>. […]
LikeLike
[…] you know how to make a simple Gantt […]
LikeLike
[…] How to make a simple Gantt chart: This article provides steps on making a Gantt chart (generally, not specific for PhD). […]
LikeLike
[…] “How to Make a Simple Gantt Chart,” by Jonathan O’Donnell on The Research Whisperer […]
LikeLike
[…] analysis of all their blog search terms. His analysis showed lots of people were looking for how to make a simple Gantt Chart. Jonathan’s excellent analysis left me wondering: what do readers think is ‘high value […]
LikeLike
If your university has the Microsoft suite of programs Viso (I think it is called) is easy to learn the basic functions to make a Gantt and the nice thing is that when you change a date the program moves the bars for you so fewer errors 🙂 winning.
LikeLike
Thanks, Wendy. Good advice.
LikeLike
[…] complex, messy, and not as linear as suggested by the timeline of activities we outline in project Gantt charts. During my doctorate, there were twists and turns as I made decisions around which literature to […]
LikeLike
[…] webinars should I register for? What about grants? Reading groups? Mentoring? How exactly does a research GANTT chart work (or does it)? How can I get research and writing done without sacrificing my entire summer on […]
LikeLike
[…] my various projects. This method was originally inspired by two academic Gantt chart enthusiasts (one, two). However, I found that the traditional way of setting up a gantt chart (with the projects on […]
LikeLike